Retrieve Findings and Import Them to Google Sheets
Use this document with our Cobalt API documentation to retrieve Cobalt findings for all pentests.
Complete the following steps:
To use our API, you need a Cobalt account with membership in your organization. Your organization owner can create an account and assign you as a member. Your organization owner is typically the user who interacts with the Cobalt Customer Success Manager (CSM).
What You Need
- Personal API token:
YOUR-PERSONAL-API-TOKEN - Organization token:
YOUR-V2-ORGANIZATION-TOKEN
Step 1: Get All Findings
Retrieve all findings of an organization with the following REST call:
curl -X GET "https://api.cobalt.io/findings" \
  -H "Accept: application/vnd.cobalt.v2+json" \
  -H "Authorization: Bearer YOUR-PERSONAL-API-TOKEN" \
  -H "X-Org-Token: YOUR-V2-ORGANIZATION-TOKEN" \
  | jq .
For more information on each parameter, see our API reference documentation on how to get all findings.
If the command is successful, you’ll see the following HTTP code:
| Message | Meaning |
|---|---|
| 200 OK | Findings for all pentests of an organization are returned. |
For a list of error codes, see the Errors section of our API reference.
Step 2: Import Findings to Google Sheets
Now that you have findings data in JSON format, you can import it to the spreadsheet software of your choice.
As an example, let’s import findings to Google Sheets.
In Google Sheets, select Extensions > Apps Script.
Use the Class UrlFetchApp service to import raw findings data. Refer to the Class SpreadsheetApp reference for details.
Run the following script to download and import Cobalt findings. Replace
YOUR-PERSONAL-API-TOKENandYOUR-V2-ORGANIZATION-TOKENwith your values.function FETCH_DATA() { var url = 'https://api.cobalt.io/findings'; var params = { headers: { 'Accept': 'application/vnd.cobalt.v2+json', 'Content-Type': 'application/vnd.cobalt.v2+json', 'Authorization': 'Bearer YOUR-PERSONAL-API-TOKEN', 'X-Org-Token': 'YOUR-V2-ORGANIZATION-TOKEN' }} var sheet = SpreadsheetApp.getActiveSheet(); var response = JSON.parse(UrlFetchApp.fetch(url, params)).data; sheet.appendRow(Object.keys(response[0].resource)); response.forEach((i) => sheet.appendRow( Object.entries(i.resource) .map(([key, content]) => { if(key == 'labels') { return content.map(c => c.name).join(','); } if(key == 'affected_targets') { return content.join(','); } if(key == 'log') { return JSON.stringify(content); } return content; }) ) ); }
Step 3: Visualize Findings Data
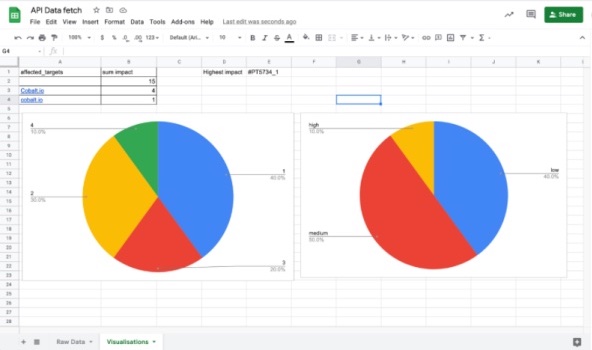
After importing raw findings data, you can create charts to visualize data. Here are some examples for Google Sheets.
- Sum of impact points per target: Use a QUERY inside a spreadsheet. The request sums up Impact Points (column G) and groups them by Affected Targets (Column J):
=TRANSPOSE(QUERY('Raw Data'!B:J, "SELECT J, SUM(G) group by J " , 1)) - Chart representing severity: In Google Sheets, select Insert > Chart, and select Column I as the data source.
- Chart representing likelihood: In Google Sheets, select Insert > Chart, and select Column H as the data source.
- Chart showing the highest severity: Use the following command:
=INDIRECT("'Raw Data'!B"&MATCH(MAX('Raw Data'!G:G),'Raw Data'!G:G,0))
The result may appear as shown in the image.

You can control who can access your Macros and Google Sheets. Fine-tune to which parts of your data specific users have access. This allows you to generate live reports without inviting users to the Cobalt platform.
Last modified November 10, 2025