Analyze Your Assets Using Insights
Get insights into the security posture of your assets.
Insights provide you an overview of all pentests performed across all assets with Cobalt. Analyze these metrics to see how the security posture of your organization evolves across assets or as an aggregate.
Insights Overview
On the Insights page, you can filter data by:
- Asset: one, multiple, or all
- Timeframe
To download the report as a PDF file, select Download.

Summary Information
At the top of the page are key metrics for the selected asset and timeframe. You can see the number of:
- Pentests performed
- Aggregated testing hours
- Findings reported
- Open findings
- Resolved findings
Here are some best practices for analyzing this data. Select the key to expand each section.
Charts
Charts visualize data for the selected asset and timeframe. Point to the chart to view tooltips with detailed information.
| Chart | Description | How to Use This Data |
|---|---|---|
| Risk Overview | Aggregated Risk for assets compared to the Cobalt Average. - Aggregated Risk is the sum of the risks of individual findings discovered in a pentest. - Cobalt Average for a given year is the average of the Aggregated Risk of all pentests conducted across all customers in that year. 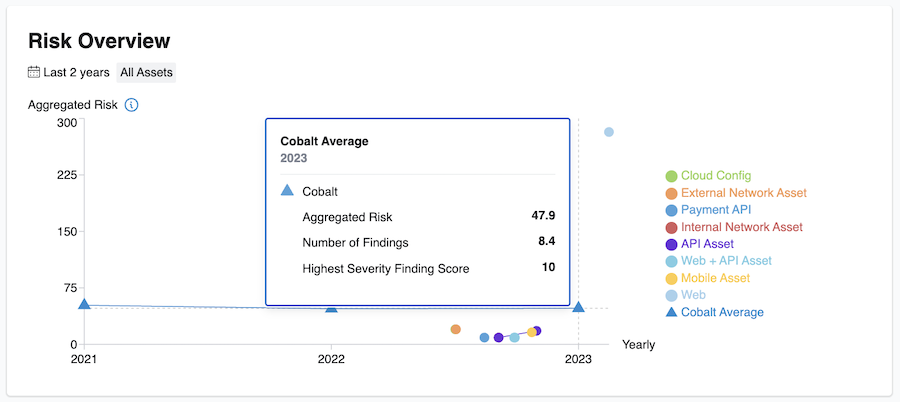 | - Compare your Aggregated Risk to the Cobalt Average to see how your security posture stands compared to others. |
| All Findings | Open (Pending Fix) and Resolved findings for each asset: - Pending Fix findings are broken down by severity levels. - Resolved findings are marked as Fixed, Accepted Risk, or Carried Over. Learn more about the meaning of each finding state. 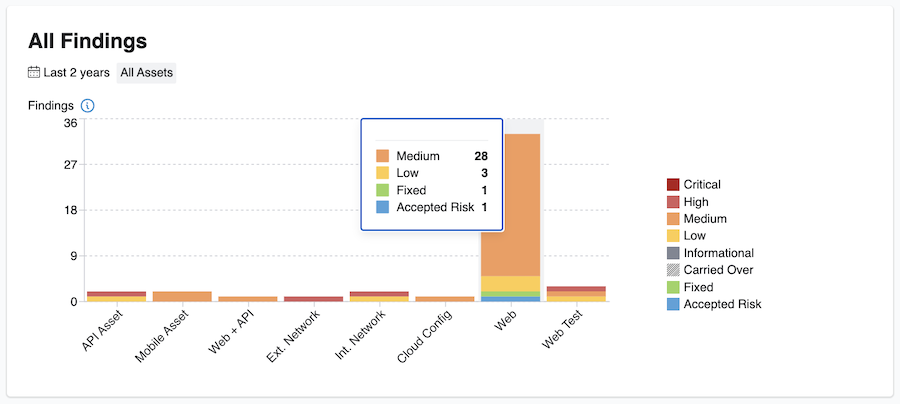 | - Analyze the number of findings that pentesters reported on each asset. - Identify assets with Critical vulnerabilities to start remediating them first. - Locate assets with Pending Fix (open) findings to remediate them. |
| All Findings by Type | Findings broken down by types for each asset. We define vulnerability types based on the industry standards such as the Common Vulnerabilities and Exposures (CVE) database. If we discover more than 10 types of findings in your asset, we only show the top 10 types and mark others as Remaining Types. 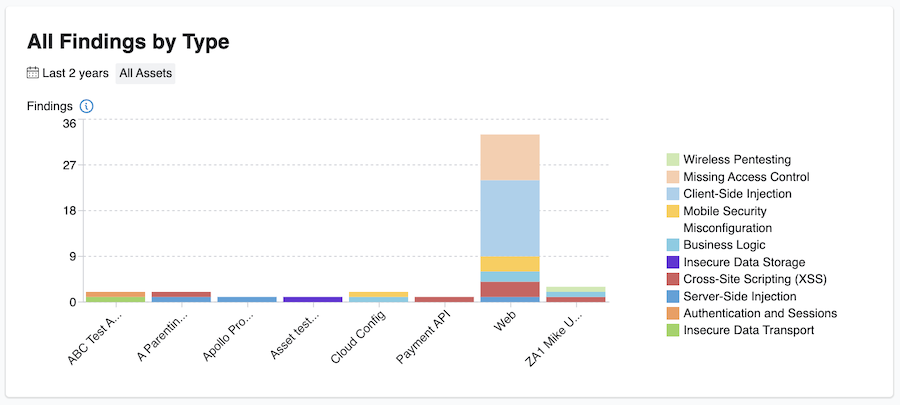 | - Identify shortcomings in how your systems were developed and what the engineering team should focus on. - Find patterns emerging across multiple asset types. Based on this data, you may want to arrange a training for your teams to fix the root cause of findings. |
| Findings by Status and Severity | Findings broken down by states and severity levels for each asset.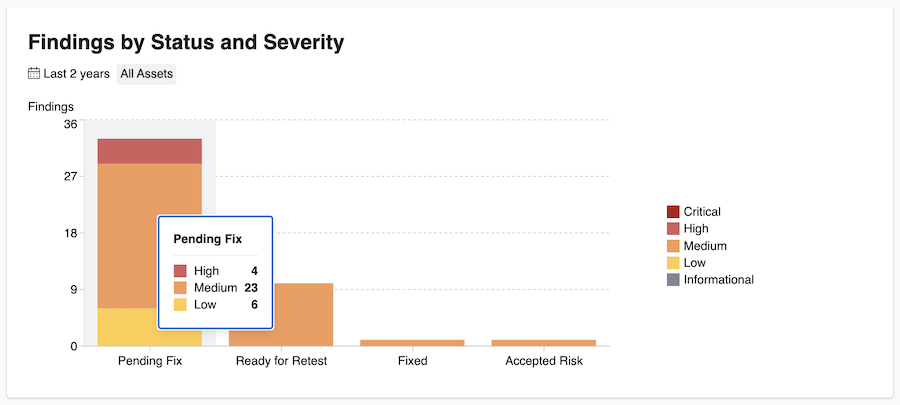 | - See how your teams are performing to remediate findings across different severity levels. - Find areas of challenge in the remediation process, and facilitate the progress. |
| Time to Fix by Severity | Time in days taken to fix findings broken down by severity levels.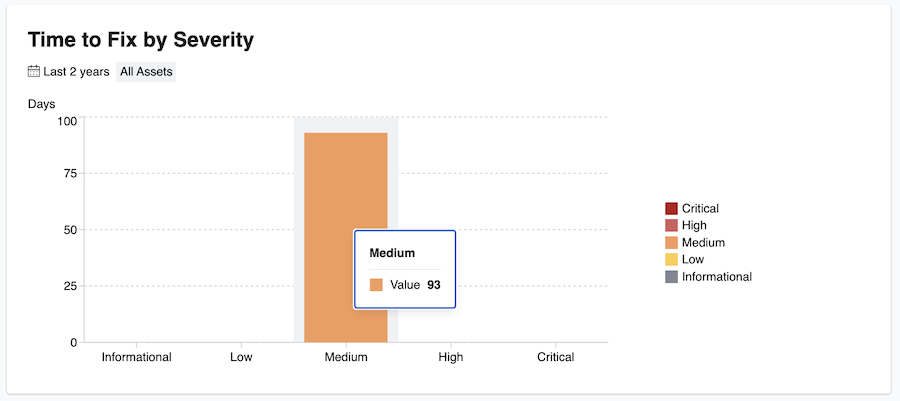 | - See how your teams are progressing in the risk remediation within an asset or across all assets. - Estimate the effort and time required for remediation to minimize risks. |
Last modified January 15, 2025